Anyone who works with Twitter knows that the use of Twitter Analytics, the free tool made available to all those who work with and on this social network, is one of the essential aspects to be able to achieve their business goals, together with listening to your Twitter followers.
Your activities cannot ignore constant monitoring of performance data. Twitter Analytics is the most essential tool, as well as free and immediate, that Twitter makes available to allow to measure your results. It is a tool that provides data on the performance of the contents you share and extrapolates statistics on them but also on your followers.
So, let’s take a closer look at what kind of useful information you can extrapolate from Twitter Analytics statistics.
Table of Contents
Log in to Twitter Analytics
To access the data, you need to connect to the site https://analytics.twitter.com/about and log in with the Twitter account data you wish to analyze.
Once logged in, what will appear will be a superficial but still interesting overview of the general performance of your account.
The data presented here refer to a precise time frame: the last 28 days.
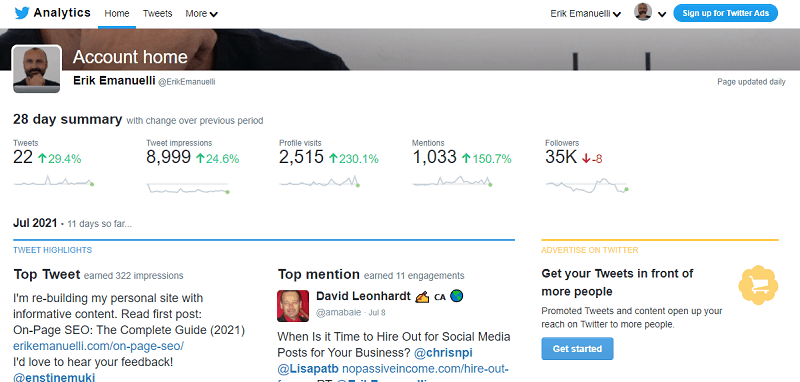
At the top, you will find the summary of the performances with the changes compared to the previous period.
In other words, you already have a first vision of the direction that your account is taking. You can see the number of tweets, views, visits to the profile mentions, followers you gained and tweets linking to your account and how that data has changed from the previous month.
Already these data, taken alone, can be useful within a strategy, because you can see in which of the main aspects of your account you are strong or weak and start making assumptions to improve.
For example, a low tweets display value could be an indication of an error in sharing; often it can be timing issues. The time you tweet is generally important to get a good number of views.
Further down, you find a more specific summary with all the best of the month:
- Most popular tweet. The one with the best performance (retweets, likes, total views and clicks on the link).
- Most popular mention. It’s the best mention in terms of total performance.
- Top Follower. This is the most popular follower you managed to gain.
- Tweet with the most popular multimedia content. The tweet that achieved the best performances (thanks, for example, to an animated gif).
- Most popular card. The card with the best performance.
Going down, you can find the same performances but from the previous month with quick summaries on the right, to quickly compare the performance of your business from month to month.
With this data, you can make a lot of things. Two sections to consider, for example, are the:
- Top follower (it is the account with the most followers who started following you over the last 28 days).
- Most popular mention (it is the account that, by mentioning you, generated the most interactions).
What can you do with this data?
For example, you can begin to collect the top followers and start building Twitter lists of popular accounts for your network, which could be involved in your daily activity (for example by mentioning them or involving them in real digital PR activities).
Tweets and Performances
If, on the other hand, you want to undertake an analysis more closely, you can analyze the Twitter Analytics statistics relating to the individual Tweets made in the last 28 days.
To view them, just click on the Tweet section, also in the strip at the top:
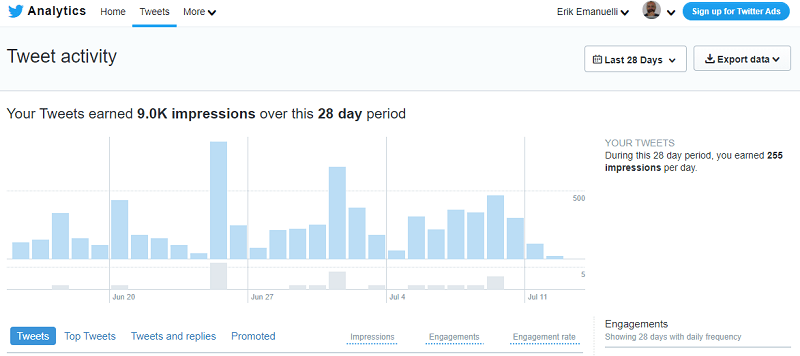
At the top, you will have the graph with the statistics of the total views over the last 28 days.
At the bottom instead, you find various grids. In the first one, the history of all the tweets we have published from the editorial plan. Therefore, the tweets replies or the tweets with multiple recipients mentioned do not appear.
The grid that appears is very simple to read. For each tweet the number of views is calculated, together with the number of interactions, but also the general rate of interaction, which is counted by taking the total number of interactions (clicks, RT, replies, new followers and likes) divided by the total number of views.
The interaction rate is one of the most important data because it measures engagement. To see the trend of the last 28 days, just move your gaze to the right (blue graph):
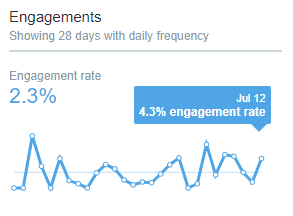
The same views and engagement rate statistics are also available for the popular tweets (those with the highest engagement rate), tweets and replies (those that mention other users) and sponsored tweets sections.
What Can You Do With This Data?
Here are some ideas. Measuring the performance of the individual tweets allows you to understand, all things being equal, which ones work best and based on what. I happened to manage communities that were easily involved thanks to the calls to action inserted in the individual tweets. Still, others were impressed by the images and videos.
Another hint on the use of this data. If, for example, your change of strategy on Twitter involves adopting a different mood and an approach that you did not have before, with new languages you can observe how it is received by the community, measuring reactions.
In addition, if your editorial plan includes the content of various kinds, such as columns, tweets with certain hashtags or specific recurring topics, you can check which ones work the most by using this hashtag tracking tool.
As mentioned before, even the views per single Tweet are an index to be taken into consideration if you want to optimize the performance of your content: poor views are often an indication of a copy that is too flat and not very attractive or a lack of attention to publication times.
Conclusion
What you have seen so far is only a part of the resources offered by Twitter Analytics, but it is enough to know to start managing your accounts more productively.
How do you make the best use of this data? Like all situations where you have a lot of information and don’t know where to start, my advice is to start with your goals.
Like all tools that provide a lot of raw information, Twitter Analytics needs to be understood and to understand something, you need to ask yourself the right questions.
And you, have you already used Twitter Analytics for your web marketing strategy?
How did you use the available data?
I’d love to know, write it in the comments!







Great article, it is very easy to create content on twitter, but if we don’t check it out the results, we will never know.
This is the first time that I did look at these analytics, I did not even know it exists 🙂 This is an informative post, you made me aware of this feature. Now I will look at this more often.
Thank you
Erika