Getting traffic is one of the most important things for webmasters: tracking and analyzing it should be always part of your internet marketing strategy.
If you are able to understand the behavior of your visitors, you can then take action to improve your site goals and conversions.
Whether you are an online business owner, a blogger or an internet marketer, you need to use the right tools, to optimize your work and increase your results.
One of the services you should consider and start implementing in your journey is a heatmap and website tracking.
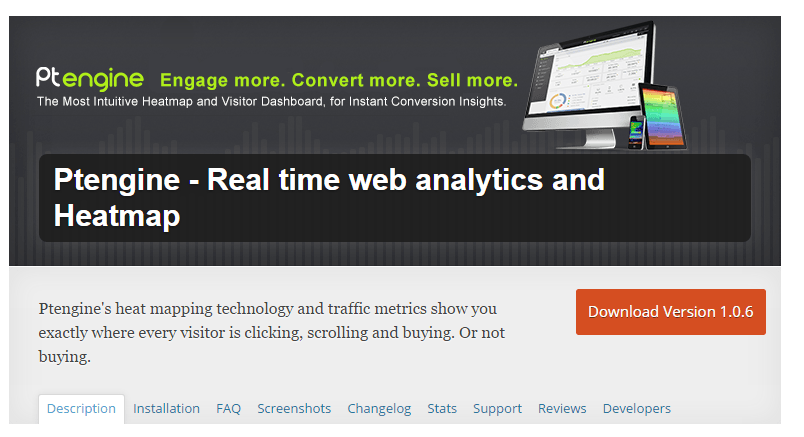
In this post, I’m going to introduce you Ptengine, a great tool you have to use to monitor your site traffic, improving your goals and conversions.
Table of Contents
How Ptengine Works
PTengine is a web analytics and heatmap platform, with a very simple to use dashboard.
Once you sign up (free registration), you can set up your site in a matter of a two minutes. Just grab the code and install it on your site, to start monitoring traffic and visits.
There are tons of features available (which I’m going to explain right away), included:
- mobile analytics and heatmaps
- goals conversions
- real-time stats
- conversion funnels
- and other interesting ones.
You may want to take at first the free trial, which offers you most of the features, with events tracked up to 20,000 pageviews per month.
So, let’s test it!
Ptengine Features
Among the websites that offer heatmaps and traffic tracking, Ptengine grants a few unique features.
Let’s see some of them into details and where you can find them within your dashboard (I installed the code on my niche site Tokyoezine – screenshots and data coming accordingly).
Real-Time Data
“Time clips” is the first tab that you will see in your dashboard when logging in to your Ptengine account.
You can get real-time details, with indication of different statistics, like the number of users, pages visited, what device and browser they are using to view your website and the sources:
- campaign
- search engine
- referral
- social site
- direct
Data Center
This is the second tab you can see in Ptengine dashboard.
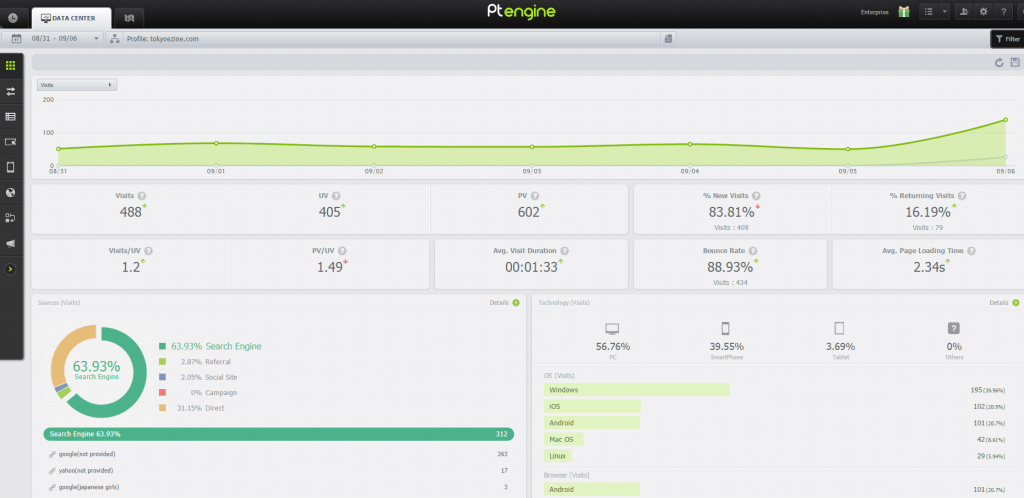
The first default option is the overview:
After selecting the time range, the first default view will be the number of visits to your website.
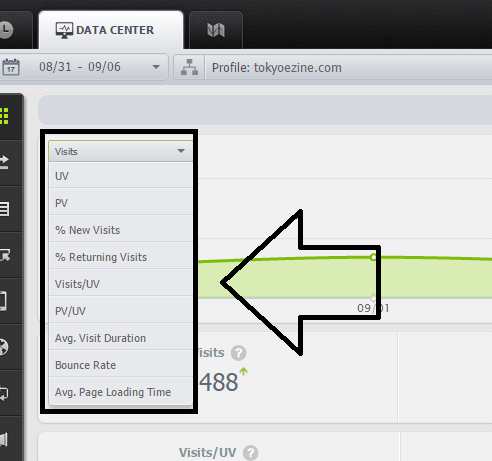
But if you click on the menu as indicated in the following image:
You will be able to check several interesting data, like:
- unique visitors
- pageviews
- % of new visits
- % of returning visits
- visits versus unique visitors
- pageviews versus unique visitors
- the average visit duration
- bounce rate
- the average page loading time
Below this graph, you can see the sources, the technology used to visit your website, the details of the pages seen by your users and where they come from.
Now if you want to set filters, under all the menu at your left, you can do that.
Filters available are, for example, the kind of sources, the content or event, the technology used by your audience, their location and the conversions of your website.
Heatmaps
This very interesting option you definitely want to check can be found in the third tab, under “page scene”.
Just select the time range and the content to be analyzed, to produce the different heatmaps.
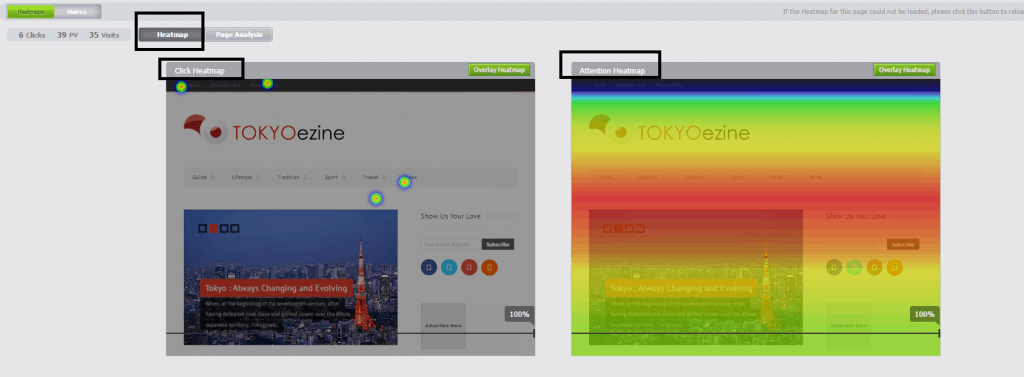
Click Heatmap
This option will display the clicking data into a thermographic map to help you check how users behave on your website.
You can basically view where your audience clicks, so to find out what drives them to do so.
Attention Heatmap
This is the other thermographic map you can check, which displays you how much time visitors spend on each section of your website (depending on colors).
These are golden information to understand where to place your ads or call to actions, like a newsletter opt-in, or the link to a landing page.
Scroll Reach Map
This option displays what percentage of your users are scrolling to which sections of your website.
Great to know where your visitors go and behave on each of your web pages.
The above-mentioned ones are just some of the features you can find when registering at Ptengine.
Ptengine WordPress Plugin
Ptengine developed a simple to use WordPress plugin, to help you getting started right away.
Just download it from WordPress directory or search it directly within your blog dashboard, under the “plugins” section.
Ptengine Plans
As mentioned, you can use the free account at Ptengine, if you will stay within the 20,000 views per month.
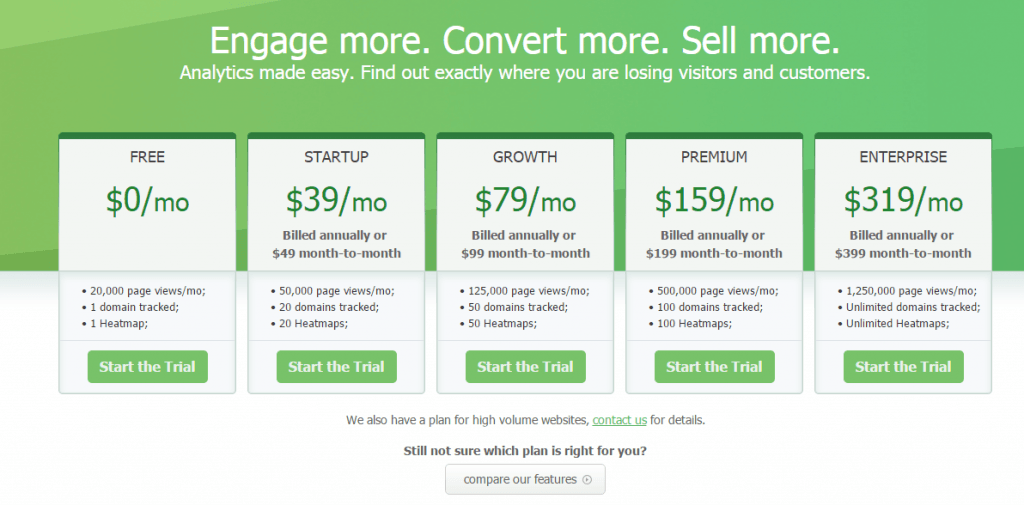
After that, you need to upgrade to a premium plan and start paying, according to the following:
If your site receives a lot of visits, then you should upgrade to “Startup” plan. You are going to pay $39 per month (if billed annually) or $49 on a monthly basis and you will be able to get up to 20 domains tracked, with up to 50,000 pageviews per month.
The best plan if the “Enterprise” ($319/mo), with unlimited domains tracked, unlimited heatmaps and up to 1,250,000 page views per month.
You can check the complete list of Ptengine plans here.
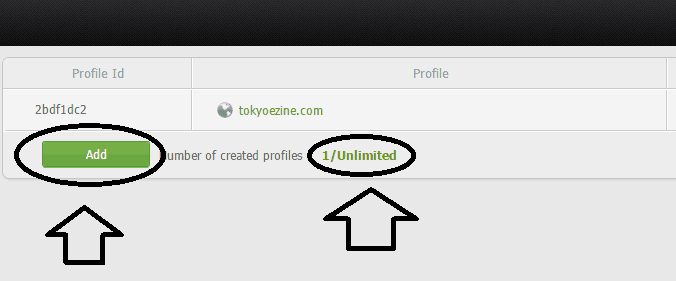
And once you upgrade your plan, you can easily add new domains under your dashboard:
Ptengine Referral Program
Other than using their platform for analyzing your site traffic and getting heatmaps, you can make money via their affiliate program.
As you are going to love its service, it’s good to promote to your friends too, right?
Then sign up to Ptengine affiliate program today and start earning by promoting their services on your sites and circles.
Conclusion
I’m more an internet marketer, then a “technical guy”, so I often find intimidating the analytics platforms, included Google Analytics itself.
Ptengine did a great work in creating a very simple to use dashboard, with several features, accessible in a matter of seconds.
There are no reasons why you should not try their service right away, also because there is the free plan, up to 20,000 pageviews per month.
Are you using a traffic analytics and heatmap service?
Which one?
Please share your views in the comments below, and thanks for sharing the post!




Hey mate, thanks!
I’ve been looking for a tool like this!
Hi Erick,
It looks something interesting..
This is the first time I heard about this and really love to work with it.
Going to download and give a try on it.
Thanks for figure out this awesome app and keep up this good work.
This is a great monitoring tools. I have never heard about it. let me have a look and do research on it.
Thanks for sharing here
I was looking for a free tool like this. Thanks for sharing Erik!
I have never heard about ptengine before. I know the importance of heatmap, so I will try it as you have recommended it here. I believe it will work good.
Hi Erik,
Few months ago I got one similar plugin like this; that was lucky orange.
I never heard about ptengine before.
Accessing heatmap is always helpful to know user behavior.
It seems ptengine have some excellent feature that could increase user engagement..
Thanks for sharing this fantastic plugin.
Regards,
Hamim
This is the first time I heard about Ptengine. It may be a good tool. Thanks for this guide Erik. I will try it now.
Thanks for the share, let me try. hope thus heat maps will provide me a better conversion. 🙂
Hey Erik,
I don’t know about this kind of knowledge that these kinds of factors are the effect of SEO or websites. Thanks for shared getting more information and really much impressive.
i love this blog. so much to learn… definitely gonna try it.
Hello Erik,
It’s indeed the unique and quality information that I just read from here. And it is the first time I saw this amazing stuff that so closely impacts the SEO of websites. Thanks to you for sharing such an incredible information.
Earlier I’d heard about the Ptengine tool but couldn’t think of using it but now will give it a try. It could be worth a tool. Kudos to you for delivering this A-Z guide Erik.
A great article on site traffic and how to improve conversions with ptengine. Thanks for sharing.